This web page was produced as an assignment for an undergraduate course at Davidson College.
Review of Paper B
Deng et al. investigated whether the maternal and paternal alleles are transcribed independently in mammalian cells. Diploid cells have two copies of each gene, but Deng at al. found that some genes exhibit monoallelic expression. This phenomenon is similar to allelic exclusion, where only one allele is transcribed, which also occurs in imprinting and X inactivation in females. With monoallelic expression only one gene is transcribed at a time, but the specific allele that is transcribed may change throughout the lifetime of the cell. The main question addressed in this paper is whether there is independent expression of paternal or maternal alleles in specific mice cells at different stages of life.
To determine if there is differential expression, they analyzed the transcriptomes of 269 individual cells from heterozygous mice embryos at specific developmental stages. The mother and father of the embryos were homozygous so it was clear which allele was maternal and which was paternal in the offspring. The origin of transcripts was determined by using single cell RNA sequencing and analyzing SNPs that were specific to either the maternal or paternal allele. RNA is lost through the process of measuring the transcripts and the technique involved random sampling, which could alter the amount of monoallelic expression observed. To ensure that they made accurate conclusions, the investigators used split-cell experiments to have two samples of the same data.
The data indicated that at specific points in time autosomal genes have monoallelic expression, where only the maternal or paternal allele is transcribed. The percentage of genes with monoallelic expression ranged from 12-24%. Transcript expression varies with developmental stage. Initially only maternal genes are expressed, because of maternal RNA present in the egg. Starting at the two-cell stage, the zygotic genes are activated. Monoallelic expression is random, because neighboring cells do not necessarily express the same alleles. This was demonstrated by comparing allelic expression of single cells and that of entire embryos. There are clearly maternal monoallelic and paternal monoallelic genes when looking at individual cells, but the trend disappears when examining an entire embryo. Many of the genes with biallelic expression were housekeeping genes. Since expression patterns change throughout developmental stages, the researchers measured transcript expression patterns in adult mouse liver cells and fibroblasts. Monoallelic expression also occurs in mature cells, not just cells of developing embryos. Differential allele transcription could help explain how the same genotype can lead to different phenotypes. Data from transcript expression patterns and levels shows that the origin of transcripts changes over the lifetime of a cell.
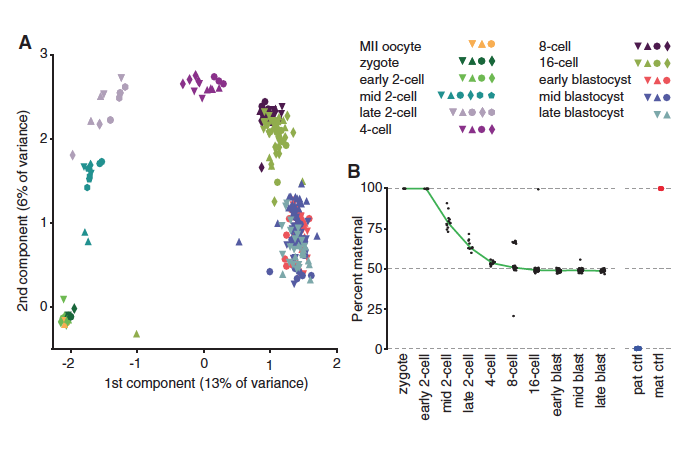
Figure 1. The origin of transcripts changes throughout development. Part A compares principle components of cells from different stages of development. The colors and shapes represent stages and embryos respectively. Gene expression varies with developmental stage, which was determined by analyzing the RNA sequences present at different times.
Part B shows that in a zygote there is only maternal RNA. The amount of maternal transcripts decreases as development progresses, to about 50% by the 4-cell stage and then remains at this ratio through the late blastula stage. The red dot represents transcripts from the mother of the embryo and the blue dot represents the paternal genes, which are both homozygous.
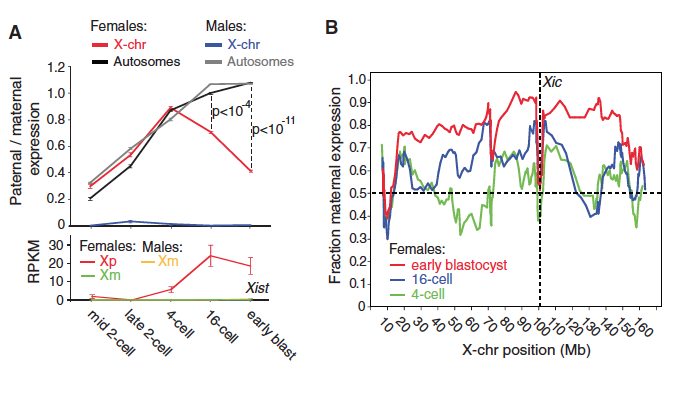
Figure 2. The graphs in this figure show the results from experiments to determine when the paternal X chromosome in females in inactivated.
The top panel of part A shows that the ratio of paternally to maternally expressed autosomes is similar in males and females. Males have low X chromosome expression, which remains fairly constant from the mid 2-cell stage until the early blastula stage. Female embryos have increasing X chromosome expression, until the 4-cell stage. At this stage, the ratio of paternal to maternal X chromosome expression starts to decrease, since one X is inactivated in each cell. The p-values indicate a statistically significant difference in the ratio of expression between X chromosomes and autosomes at the 16-cell and early blastula stages in female embryos. The bottom panel of A shows that Xist expression is similar in maternal X chromosomes of male and female embryos. Xist is a gene involved in X chromosome inactivation by covering the DNA so it cannot be transcribed. However, Xist from the paternal X chromosome in females increases until the 16-cell stage.
Part B shows that there is more maternal expression at later stages of embryonic development because the paternal X chromosome is inactivated. The distance from the X-inactivation center does not impact X chromosome inactivation. Instead of females inheriting an inactivated X chromosome from their father, the paternal X chromosome is transcribed until de novo inactivation occurs.
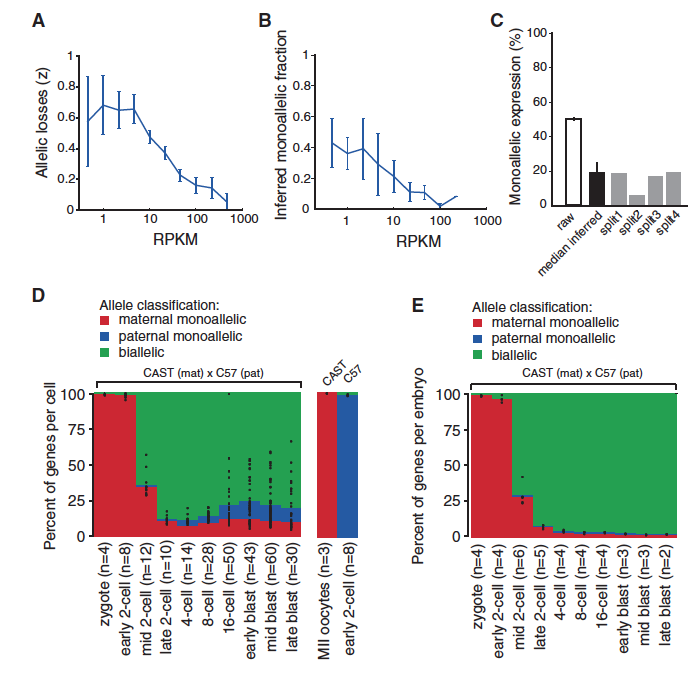
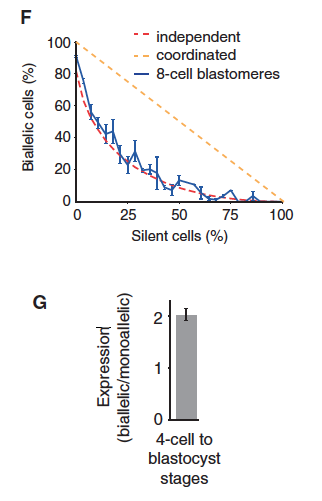
Figure 3. Since the RNA sequencing methods used to determine which allele is present can decrease the amount of RNA in the sample and skew conclusions, Deng et al. adjusted their techniques to avoid overestimating the amount of monoallelic expression.
Graph A is a prediction of how many alleles are lost through the experimental process of using split samples. Graph B shows how many genes are predicted to have monoallelic expression, while Graph C compares the percentages of predicted monoallelic expression in raw and split-cell experiments. The split-cell experiments have lower predictions for monoallelic expression. Parts D and E both illustrate that gene expression changes throughout development. Initially there is monoallelic maternal expression. Starting at the mid 2-cell stage, expression is mostly biallelic with smaller percentages of maternal and paternal monoallelic expression. The difference between D and E is that D represents genes in an individual cell, while E represents entire embryos. The comparison between D and E indicates that gene expression in one cell is not the same as expression in a nearby cell. This suggests that the allele that is expressed in a specific cell is random. Part F shows a clear correlation between the percentages of bialleic cells in 8-cell embryos with the prediction of genes with independent allele expression. The data do not match predictions for coordinated allele transcription. The figure labeled G shows that when both alleles are expressed there is twice as much RNA than if only one gene is transcribed. All of the data in figure 3 support the ideas that split cell experiments are an accurate way to account for loss of RNA and monoallelic gene expression is a random event specific to individual cells.
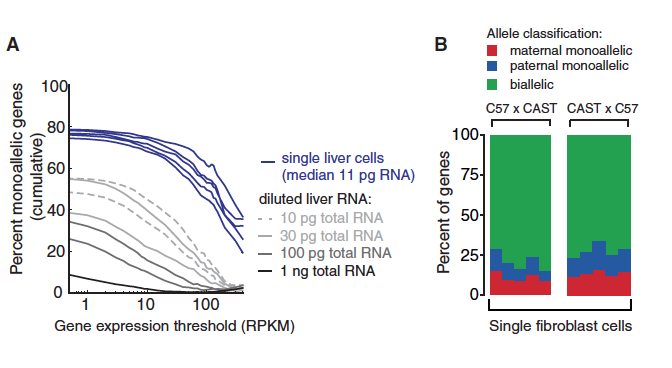
Figure 4. The data depicted in this figure show that there is monoallelic gene expression in mature cells, not just embryonic cells. The graph in part A illustrates the percentage of monoallelic expression in single liver cells and dilutions of liver RNA. As expected, the dilutions had lower percentages of monoallelic genes. The reciprocal crosses in part B depict allele expression in mouse fibroblasts. The majority of RNA is transcribed from both alleles, but there is also specific maternal and paternal expression in embryos from both crosses.
Review
Deng and colleagues presented questions in their paper about expression of maternal and paternal allele expression, which they answered with data that strongly support their claims. The comparisons of heterozygous embryonic cells to the parental controls were beneficial for distinguishing the origin of specific transcripts and confirming that their methods are accurate since they know the parental lines are different homozygous genotypes. They also admitted that the RNA sequencing process decreased the amount of RNA present in a sample and they then adjusted their methods accordingly. The majority of figures in this article were clearly labeled and the colors were an effective way to distinguish different stages and cells since there was enough contrast between the groups. The bar graphs showing genes that were expressed as monoallelic maternal, monoallelic paternal, or biallelic were an effective way of visually showing the different origins of transcripts as percentages of the transcriptome. The comparison between paternal and maternal expression of autosomes versus X chromosomes was necessary to show that in females the change in transcription is not simply a result of X inactivation.
There are some portions of the article that could have been explained further. For example, it would have been helpful if RPKM were defined, although it is easy enough to look up. In addition, it is not entirely clear what the 1st and 2nd components are in Figure 1A. The figure legends explained that in some of the experiments the number of cells analyzed varied from 3 to 28 cells for different conditions (Figure 2A). Such a vast difference in sample size for each condition could raise questions, especially since 3 cells may not be a representative sample. Graphs A-C of Figure 3 were initially confusing since the lines of A and B were predictions and part C was not explained in the text. It is possible that unclear information was explained in the supplementary figures. In addition, Figure 3 contained a lot of data that could have been divided into two separate figures. It would be interesting for future research to conduct similar experiments showing allelic expression in even more tissues and in other organisms. Another possible area to investigate would be monoallelic gene expression as a cause or result of certain diseases, especially since mutations in imprinted genes can severely affect phenotypes.
Genomics Page
Biology Home Page
© Copyright 2014 Department of Biology, Davidson College, Davidson, NC 28035